Task family 01
Fine-grained attributes
Identity, structure, appearance, condition and interaction, grounded at the organism level.
NeurIPS 2026 · Evaluations & Datasets
A Large-Scale Underwater Dataset for Fine-Grained Attribute Understanding and Grounded Counting Perception
* Equal contribution† Corresponding author
Underwater imagery records rich ecological information and supports applications such as science communication, fishery monitoring, ecological conservation, and oceanographic research. Beyond general scene understanding, these applications require models to recognize fine-grained biological traits and reason over spatially grounded evidence. However, existing underwater datasets often provide coarse category labels, generic captions, or total-count supervision, which limits their use for organism-level analysis and ecological reasoning. We introduce Nereus, a large-scale dataset for fine-grained underwater perception that jointly supports Fine-Grained Object Attribute Understanding and Grounded Counting Perception. Nereus contains 88K images and 2.68M question-answer pairs, including annotations for 136K marine organism objects across 2,690 species and 1,515 genera, as well as 65K point annotations and 67K grounded counting QA pairs. Experiments with representative multimodal models show that Nereus improves downstream adaptation over existing underwater-domain data and provides a foundation for future research on fine-grained marine perception.
Manuscript abstract. Dataset version and statistics note.
Nereus connects fine-grained underwater attributes with spatially grounded counting.
A dataset and evaluation resource for asking not only what is present, but what the image supports.
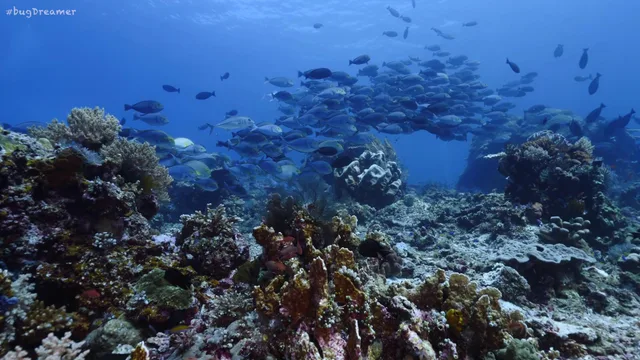
Underwater scenes combine clutter, camouflage and densely overlapping organisms.
A category name does not describe morphology, condition or interaction.
A total count does not explain where organisms gather or how their surroundings relate to that pattern.
The manuscript reports 88,555 images and approximately 2.68 million question-answer pairs.
The schema spans 136 attribute dimensions. Fields are organism-specific, not universal to every object.
Heterogeneous underwater sources are organized into object-centered and point-grounded supervision.
Object crops, image context and biological priors support multi-model attribute discussion and arbitration.
Point annotations support region counts, visibility labels, density maps and evidence-linked questions.
Annotation combines model-assisted generation with targeted human review and expert calibration.
Quality ratings and selected-case arbitration are not a whole-dataset accuracy estimate.
A localized fish example links rough texture, high camouflage and a hiding-in-coral interaction label.
The cuttlefish record describes mottled skin, high camouflage and a resting posture.
The coral record combines fan-like growth, intact tissue and a coral-rock contact label.
Region-aware counting links each annotated fish to image coordinates and spatial cells.
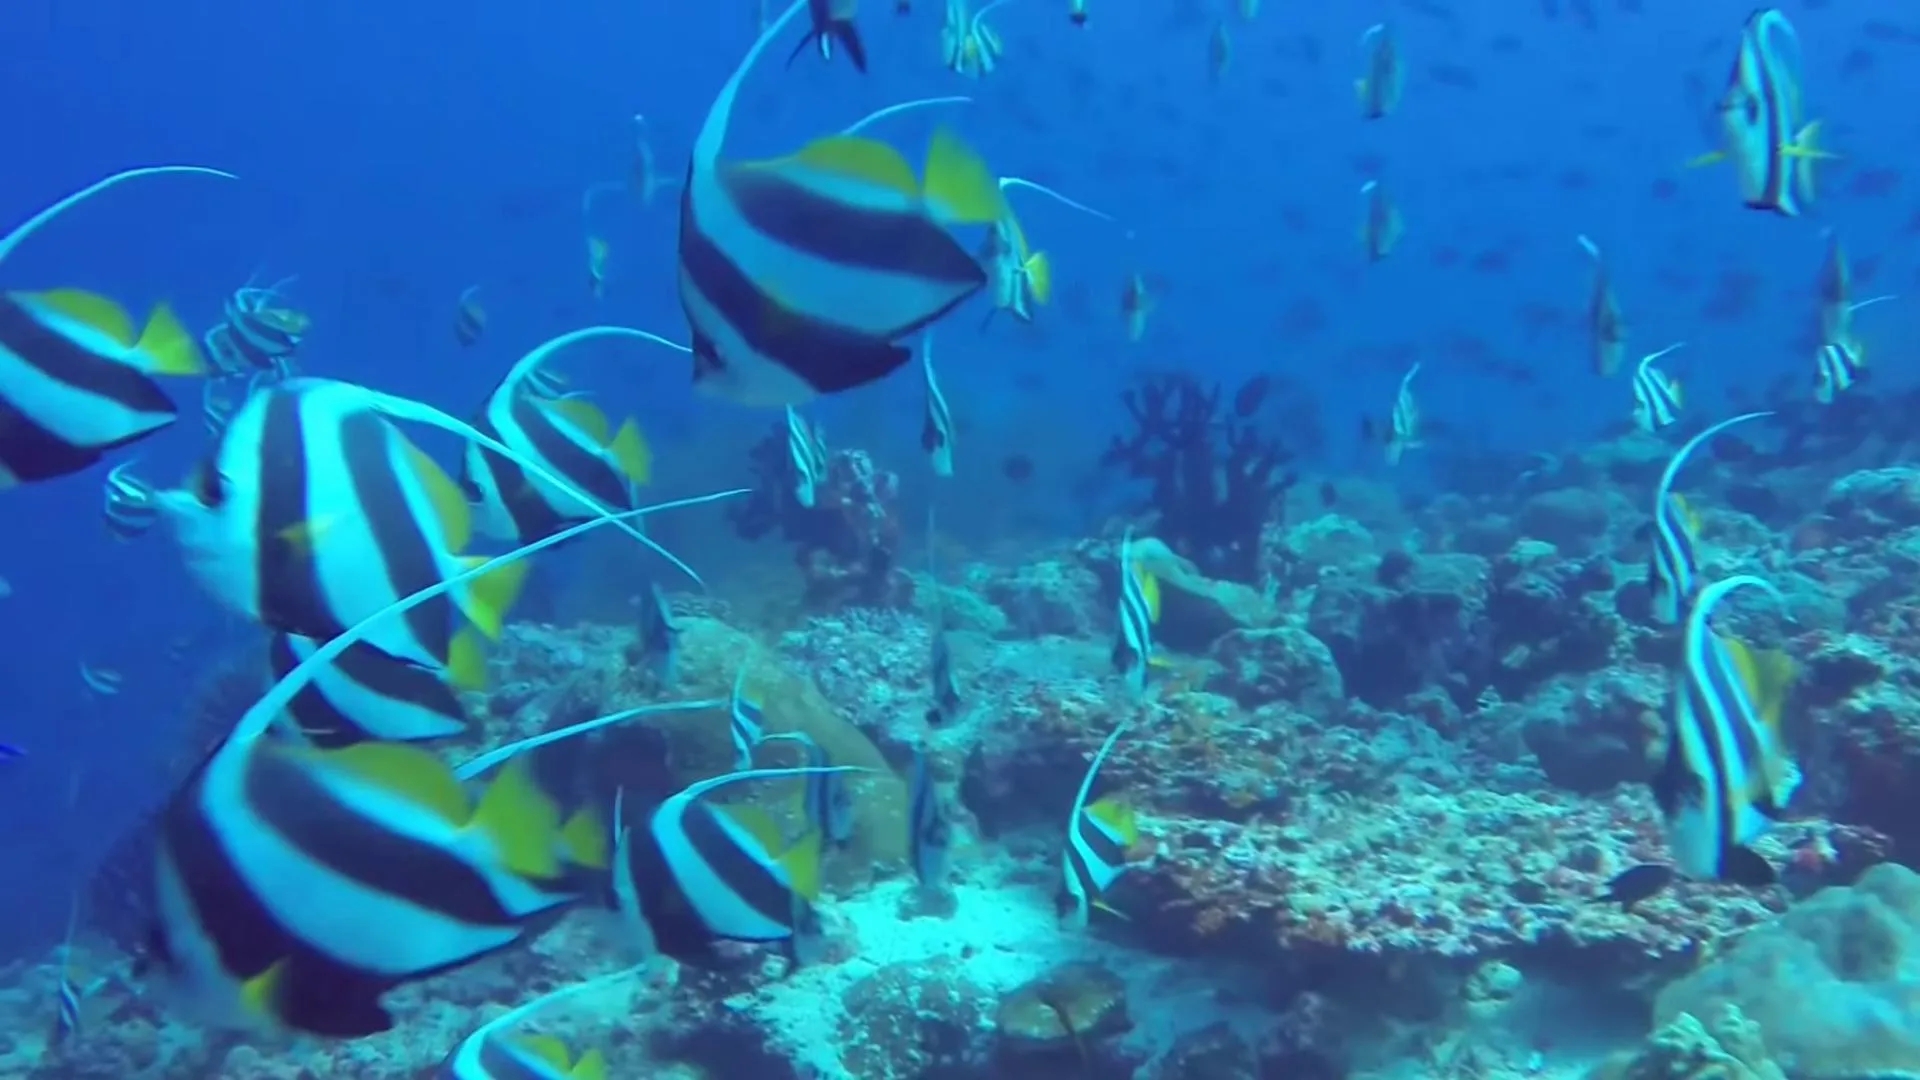
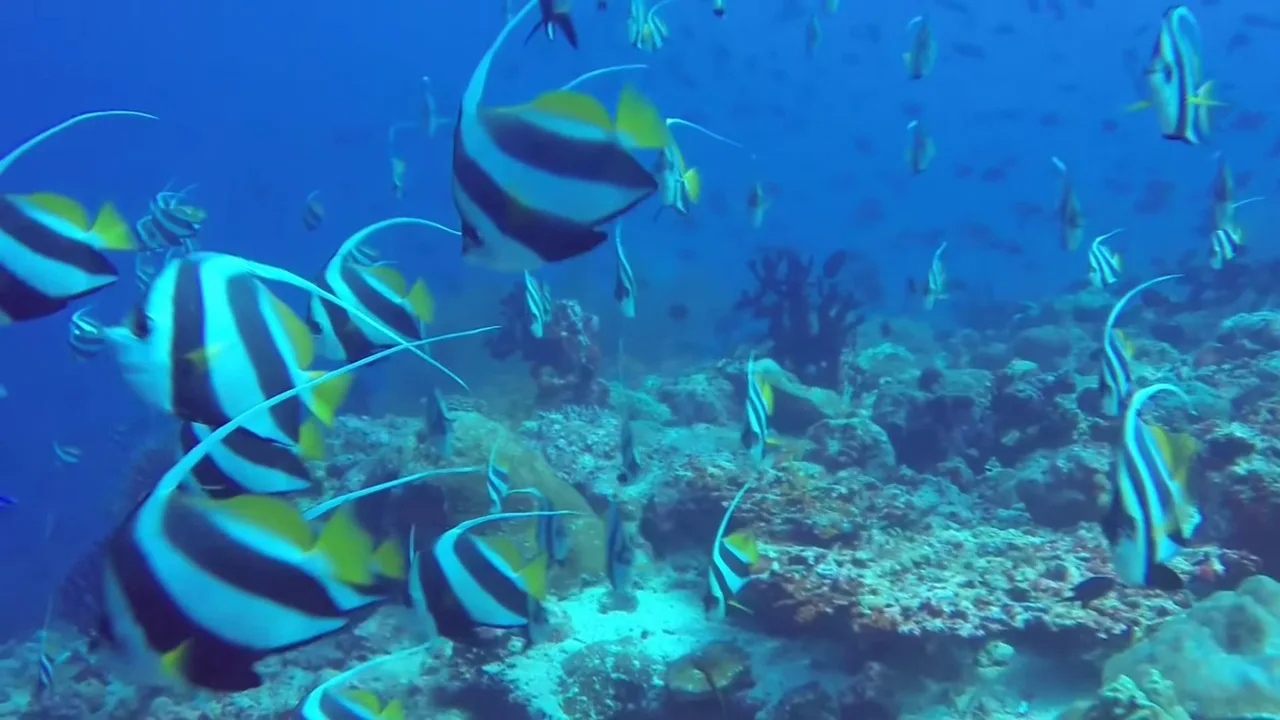
Sample 0000 contains 90 annotated fish. Its densest grid cell is top-right, with 31.
Semantic memberships include 82 open-water and 5 reef-rock labels. Region memberships can overlap.
Camouflage-state counting separates clear, ambiguous and highly camouflaged annotations.
Sample 0001 has 134 clear, 130 ambiguous and 6 highly camouflaged point annotations.
The close-up shows source-image evidence for highly camouflaged annotations.
Colored points are annotation labels, not model predictions.
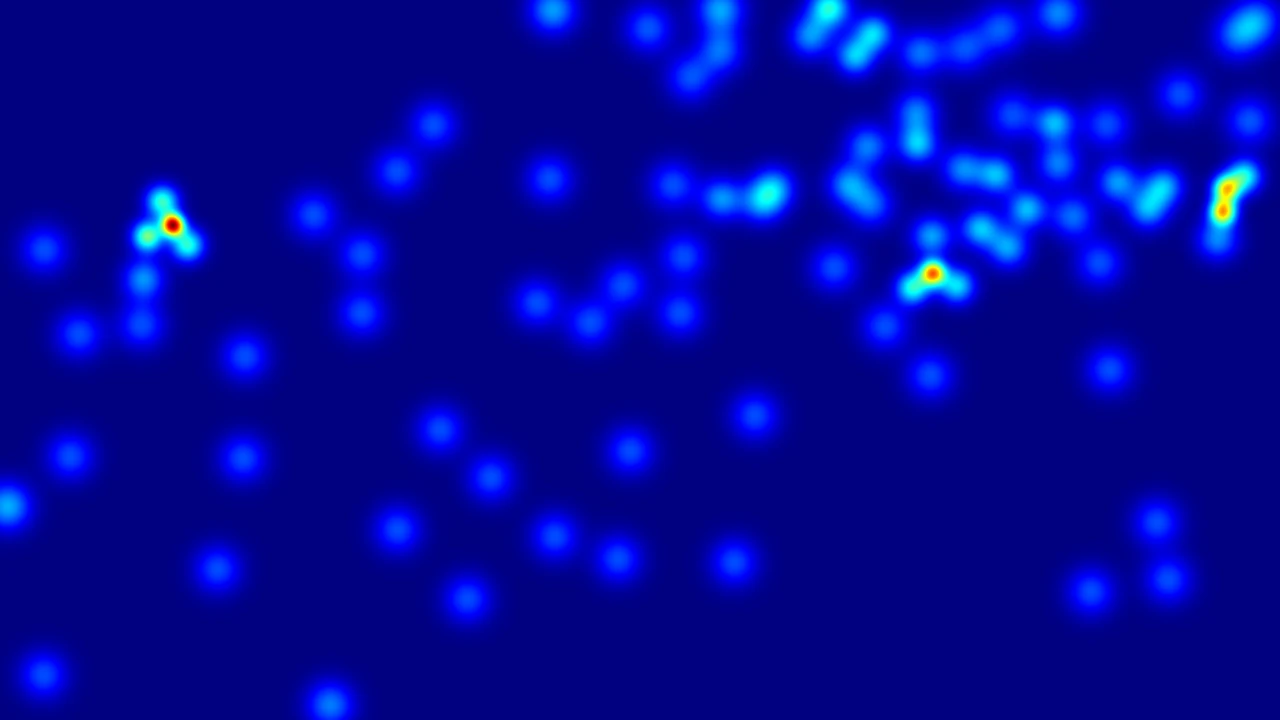
Density-hotspot reasoning starts from a localized response in a supplied annotation-derived heatmap.
In open water, the annotation relates aggregation to available swimming space and possible schooling.
Near branching coral, visible habitat structure grounds the description of the fish aggregation.
Shelter and food are annotation hypotheses, not verified causes. Depth labels are relative, not metric.
Track A uses RGB only. Track B additionally supplies a ground-truth-derived density heatmap.
Count error, relative count accuracy and grounded reasoning measure different capabilities.
Table 2 reports higher attribute accuracy after Nereus supervision for all three open backbones shown.
For InternVL2.5-8B, Table 3A reports lower count MAE and higher densest-cell accuracy under QAS.
Use the stated input conditions and source licenses. Ecological interpretations require domain validation.
Explore the data, research code and interactive examples on the Nereus project page.
Counting imagery: Guolei Sun et al., IOCfish5K, CC BY-NC 4.0. Attribute imagery: FathomNet / FathomVerse contributors and NOAA Ocean Exploration; original image terms include CC BY-NC-ND 4.0. The project owner authorized this public presentation; upstream rights remain applicable.
Source provenance and video metadataMarine perception needs more than a category label or a single count.
Nereus connects object-level biological detail with spatially grounded evidence. It supports two complementary task families for the challenging visual conditions of the underwater world.
How Nereus is builtIdentity, structure, appearance, condition and interaction, grounded at the organism level.
How many, where, under what visibility, and with what density evidence.
All headline numbers describe the supplied manuscript, not a freshly recounted release. It additionally reports 136K objects, 1,515 genera, 65K points and 67K grounded counting QA pairs (abstract, p. 1). The point total conflicts with IOCfish5K's 659,024 source annotations; the organism-group totals in Figure 3 also do not reconcile with 136K. These totals are pending author reconciliation and are not presented as verified release counts.
Real Nereus annotations: from an organism in its habitat to morphology, appearance, condition and behavior.
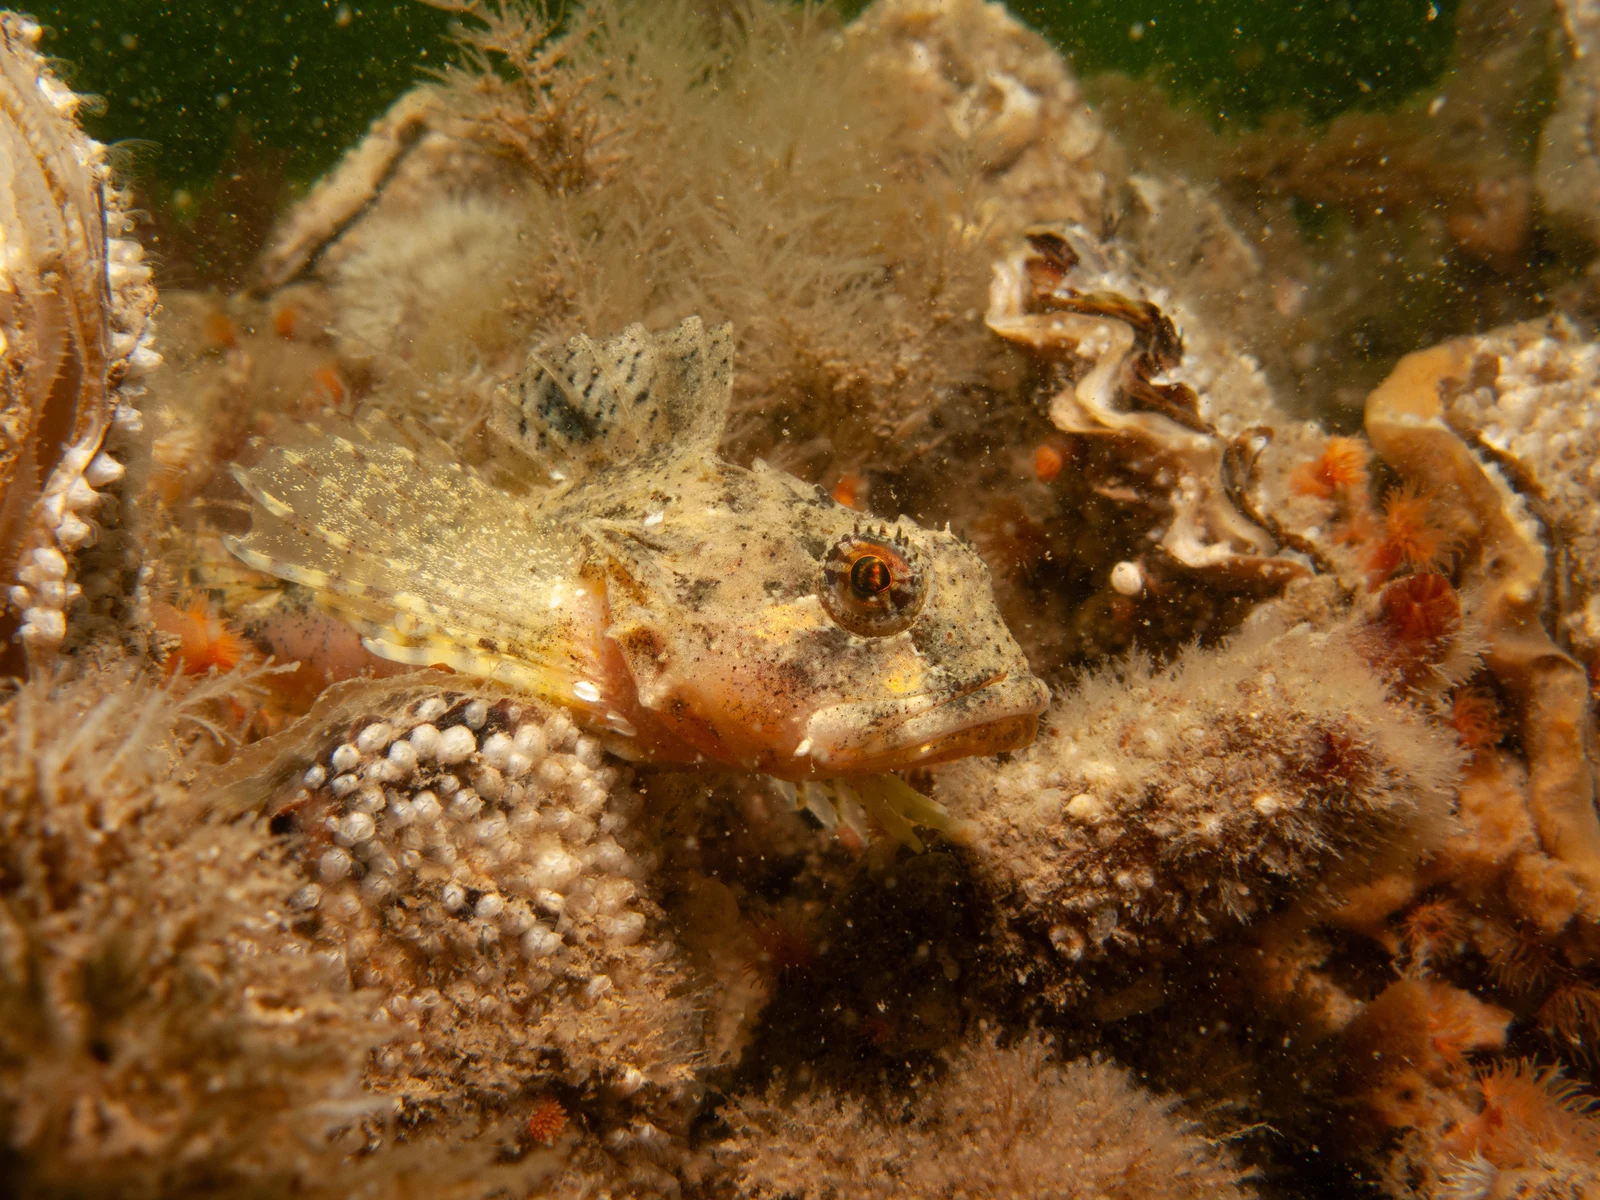
Original image record · FathomNet / FathomVerse (see original source record) · CC BY-NC-ND 4.0
Fish · 19 annotated attributes
Source labels, not model predictions. Whole-object boxes; no part-level localization is implied.
{
  "image": "2c852905-9fb3-46bb-927f-4d90195afb0f.jpg",
  "width": 4000,
  "height": 3000,
  "objects": [
    {
      "bbox": [
        553,
        773,
        2110,
        1358
      ],
      "group": "Fish",
      "concept": "Scorpaenidae",
      "attributes": {
        "species": "Scorpaena jacksoniensis",
        "diagnosis": "Prominent eyes, rough texture, and mottled coloration with a flattened body shape.",
        "dorsal_fin": "present",
        "caudal_fin": "absent",
        "pectoral_fin": "present",
        "pelvic_fin": "present",
        "anal_fin": "present",
        "adipose_fin": "absent",
        "barbel": "absent",
        "body_shape_lateral": "flattened",
        "type_of_eyes": "large-eyed",
        "type_of_mouth_snout": "terminal mouth",
        "cross_section": "compressed",
        "dorsal_head_profile": "convex",
        "color": "multicolored",
        "camouflage": "high",
        "texture": "rough",
        "body_damage": "none",
        "interaction": "['hiding-in-coral']"
      }
    }
  ]
}
Local research preview. Image sources carry ND restrictions; public use of animated zoom and annotation overlays requires rights review. Per-image provenance.
The same scene, viewed through spatial, visibility and density evidence. These are dataset annotations, not live model predictions.
Point annotations connect exact counts to spatial cells and semantic scene regions.
Sample 0000 contains 90 annotated fish. Its densest grid cell is the top-right, with 31. Semantic memberships include 82 fish in open water and 5 in reef / rock. Grid partitions and semantic memberships are different counting views; semantic regions can overlap.
Clear, ambiguous and highly camouflaged annotations separate counting difficulty from the total count.
Sample 0001 contains 270 annotated fish: 134 clear, 130 ambiguous and 6 highly camouflaged. Point colors follow the dataset visibility labels; close-ups show the corresponding image evidence.
Localized density responses lead to visual evidence, relative-depth annotations and interpretations of how fish interact with their environment.
Sample 0001, hotspot 1: open blue water without visible bottom structure. The source relative-depth tag is relatively deeper. Annotation interpretation: open swimming space may support schooling or temporary aggregation. Sample 0003, hotspot 1: branching coral with fish nearby. The source relative-depth tag is relatively shallower. Annotation interpretation: reef structure may offer shelter and food, relating to nearby aggregation. Dashed outlines mark source context patches; camera crops are presentation choices. Depth tags are relative, not measured distances. These ecological interpretations are annotation hypotheses, not verified causes or observed feeding behavior.
Source evidence and annotation excerptsImagery: Guolei Sun et al., IOCfish5K · CC BY-NC 4.0. Animated overlays and crops from Nereus annotations. Not model predictions.
Points, regions, visibility and density evidence.
 IOCfish5K / 0000
Based on the grid count, there are 42 fish in the right region and 20 fish in the left region. Therefore, the right region has 22 more fish than the left region (42 - 20 = 22).
Evidence explorer. RGB, points, semantic-region boxes, visibility labels and precomputed density maps are aligned to the same sample. Region memberships may overlap; boxes are not pixel masks. Hotspot ecological interpretations are model-generated annotations, not established causal findings. Source & license
Two complementary annotation pipelines connect biological knowledge, visual evidence and structured supervision.
Object localization and contextual crops.
Taxonomic knowledge priors.
Independent models compare answers.
Uncertain cases reach a larger model.
Calibrated quality scoring and expert checks.
Existing IOCfish5K point annotations.
Semantic regions and spatial grids.
Clear, ambiguous and camouflaged states.
Point-derived density and local hotspots.
Grounded QA with spatial evidence.
Qwen3-VL-8B and InternVL3-8B discuss attribute annotations; low-confidence cases go to Qwen2.5-VL-72B. GPT-4o quality assessment is calibrated by three marine-biology master's students, with expert arbitration for low-scoring test annotations.
Reported quality: 9.26/10 on 200 sampled training images and 9.14/10 on test annotations. These are quality ratings, not percentage accuracy. Sections 3.2 and 4.1; Appendix A.1.
Representative multimodal backbones, distinct evaluation protocols, and the trade-offs behind the headline results.
Overall accuracy (%) and semantic similarity (0–100) are distinct measures. Open backbones use language-side LoRA; the visual encoder is frozen. Table 2, p. 7; Appendix A.2, p. 15.
| Backbone | Zero-shot ↑ | NautData ↑ | MarineInst20M ↑ | Nereus ↑ | Nereus SIM ↑ |
|---|---|---|---|---|---|
| LLaVA-OneVision-7B | 10.48 | 12.06 | 13.56 | 48.91 | 74.10 |
| InternVL2.5-8B | 11.12 | 16.08 | 9.97 | 48.10 | 76.20 |
| Qwen2.5-VL-7B | 13.22 | 17.09 | 14.64 | 41.55 | 73.10 |
Gemini 2.0 Flash zero-shot: 17.86% accuracy, 57.90 similarity. Fine-tuned results are not reported for Gemini. Values reproduced from Table 2, p. 7.
RGB-only evaluation: total count, densest 3×3 grid cell and camouflage states. MAE is lower-is-better; accuracy and F1 are higher-is-better. Acc@5 is within ±5% of ground-truth count, not ±5 fish. Table 3A, p. 8; Appendix B.3, p. 21.
| Backbone | Setting | MAE ↓ | Exact % ↑ | Acc@5 % ↑ | Cell % ↑ | Camo F1 % ↑ |
|---|---|---|---|---|---|---|
| Gemini 2.0 Flash | ZS | 52.80 | 9.08 | 11.12 | 28.79 | 18.94 |
| Gemini 2.0 Flash | P-ZS | 50.50 | 8.86 | 13.29 | 15.50 | 17.09 |
| Gemini 2.0 Flash | Full | 55.50 | 9.04 | 12.68 | 7.62 | 12.73 |
| Qwen2.5-VL-7B | ZS | 98.33 | 5.51 | 5.51 | 7.62 | 9.58 |
| Qwen2.5-VL-7B | P-ZS | 94.34 | 7.26 | 7.44 | 4.61 | 2.38 |
| Qwen2.5-VL-7B | Count | 38.57 | 9.92 | 16.83 | 6.11 | 7.41 |
| Qwen2.5-VL-7B | QAS | 31.98 | 10.01 | 18.51 | 49.16 | 52.85 |
| Qwen2.5-VL-7B | Full | 36.19 | 10.36 | 16.56 | 47.39 | 54.06 |
| LLaVA-OneVision-7B | ZS | 113.61 | 4.63 | 4.63 | 0.00 | 10.26 |
| LLaVA-OneVision-7B | P-ZS | 104.38 | 6.24 | 6.24 | 0.18 | 13.33 |
| LLaVA-OneVision-7B | Count | 79.47 | 7.26 | 8.77 | 0.09 | 16.90 |
| LLaVA-OneVision-7B | QAS | 52.81 | 8.06 | 12.84 | 32.68 | 28.91 |
| LLaVA-OneVision-7B | Full | 52.27 | 8.06 | 12.22 | 36.67 | 35.57 |
| InternVL2.5-8B | ZS | 87.38 | 2.22 | 2.22 | 22.85 | 21.26 |
| InternVL2.5-8B | P-ZS | 167.55 | 0.00 | 1.16 | 20.73 | 18.98 |
| InternVL2.5-8B | Count | 31.72 | 10.01 | 19.04 | 20.81 | 14.72 |
| InternVL2.5-8B | QAS | 25.99 | 10.45 | 20.46 | 52.70 | 50.02 |
| InternVL2.5-8B | Full | 30.48 | 9.74 | 18.95 | 51.90 | 52.59 |
Main Table 3 values are retained. InternVL baseline camouflage F1 conflicts with supplementary Table 11; see version notes and release review. Gemini's “Full” label does not establish that Gemini was fine-tuned.
RGB plus ground-truth-derived density heatmap. This evaluates interpretation of supplied density evidence, not autonomous density estimation from RGB. All metrics are percentages, higher-is-better. Table 3B, p. 8.
| Backbone | Setting | Hotspot acc. ↑ | Density F1 ↑ | Ecology / grounding F1 ↑ |
|---|---|---|---|---|
| Gemini 2.0 Flash | ZS | 44.88 | 18.35 | 16.48 |
| Gemini 2.0 Flash | Full | 41.91 | 18.22 | 16.15 |
| Qwen2.5-VL-7B | ZS | 41.75 | 18.13 | 16.04 |
| Qwen2.5-VL-7B | D-QA | 37.39 | 45.26 | 37.19 |
| Qwen2.5-VL-7B | Full | 35.37 | 45.24 | 37.14 |
| LLaVA-OneVision-7B | ZS | 32.86 | 18.98 | 17.34 |
| LLaVA-OneVision-7B | D-QA | 1.42 | 28.27 | 23.90 |
| LLaVA-OneVision-7B | Full | 47.48 | 30.32 | 25.22 |
| InternVL2.5-8B | ZS | 42.13 | 19.80 | 18.37 |
| InternVL2.5-8B | D-QA | 37.59 | 45.26 | 36.35 |
| InternVL2.5-8B | Full | 38.70 | 43.24 | 35.00 |
Density F1 improvements do not imply universal gains: Qwen D-QA hotspot accuracy falls from 41.75 to 37.39 while density F1 rises from 18.13 to 45.26.
Qwen2.5-VL-7B with different training supervision, evaluated on the same 1,129 Nereus Track A test samples. Nautilus-to-Nereus transfer, not evaluation on an external test set. Table 9, p. 18.
| Training supervision | MAE ↓ | RMSE ↓ | Exact % ↑ | Acc@5 % ↑ | Acc@10 % ↑ | Cell % ↑ | Camo F1 % ↑ |
|---|---|---|---|---|---|---|---|
| Nautilus counting SFT | 39.96 | 158.50 | 9.65 | 16.30 | 24.53 | 6.11 | 8.48 |
| Nereus Count | 38.57 | 89.59 | 9.92 | 16.83 | 26.66 | 6.11 | 7.41 |
| Nereus QAS | 31.98 | 78.25 | 10.01 | 18.51 | 29.85 | 49.16 | 52.85 |
| Nereus Full | 36.19 | 84.74 | 10.36 | 16.56 | 25.33 | 47.39 | 54.06 |
Qwen2.5-VL-7B. Structured attributes improve overall accuracy over object captions; image enhancement does not automatically improve fine-grained perception.
| Setting | Overall acc. % ↑ | Overall SIM ↑ | Source |
|---|---|---|---|
| QA pairs | 39.08 | 55.20 | Table 4, p. 9 |
| Object-level caption | 16.78 | 61.60 | Table 4, p. 9 |
| Structured attributes / original image | 41.55 | 73.10 | Tables 4 and 8, pp. 9, 18 |
| Degradation prior + original | 40.51 | 74.60 | Table 8, p. 18 |
| Degradation prior + enhanced | 37.36 | 71.80 | Table 8, p. 18 |
Not every attribute category follows the overall ranking. QA-pair supervision scores 77.90% on ecological health versus 39.92% for structured attributes (Table 4).
No statistical significance or confidence intervals are claimed. These are manuscript values, not new experiments run for this website.
Curated annotation examples, not a model leaderboard. Dense scenes, occlusion and language-grounding errors remain open challenges.
134 clear, 130 ambiguous and 6 highly camouflaged instances. A single total conceals how differently targets can appear.
Final annotations · visibility summary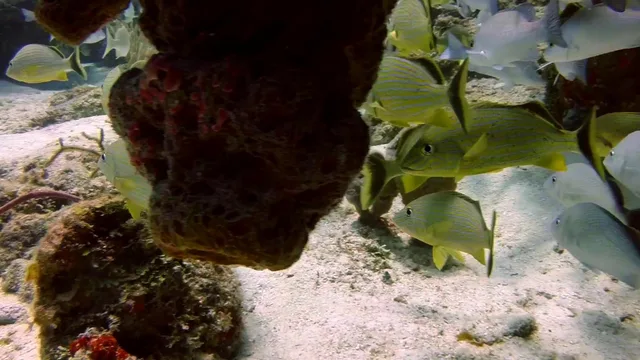
20 point annotations include 6 clear, 11 ambiguous and 3 highly camouflaged instances, reflecting difficult boundaries between visible evidence and interpretation.
Final annotations · visibility summaryFour stored hotspots connect local density to scene evidence. Ecological explanations remain hypotheses requiring expert review.
Final annotations · density hotspots“The densest grid area is 'top-right' (top-right corner), with 70 fish”
Top-center: 87. Top-right: 70. The released answer overlooks the actual maximum. The explorer preserves the structured values; the source QA file is not modified.
A concrete annotation-quality failure, not a measured model prediction. Numeric consistency checks and semantic review remain necessary.
Coverage is uneven across taxa, geography, depth and imaging devices. Automated localization and multimodal annotation can introduce noise. Image-level degradation labels do not measure local water quality or hidden biological states. Results do not show universal gains across every metric, and the manuscript reports no error bars.
Limitations · pp. 9, 15–16; checklist p. 24Hugging Face repository
Official GitHub repository
Public PDF coming soon
Provisional manuscript citation. The author list is confirmed; publication details and the arXiv identifier are forthcoming.
@misc{deng2026nereus,
  title = {Nereus: A Large-Scale Underwater Dataset for Fine-Grained Attribute Understanding and Grounded Counting Perception},
  author = {Deng, Jingtao and Jin, Zihao and Chen, Yuehe and He, Feixiang and Li, Shuiwang and Zeng, Dan},
  year = {2026},
  url = {https://github.com/BRL-SYSU/Nereus},
  note = {Research manuscript; final publication details forthcoming}
}Counting license · Source notice · Third-party sources
Counting imagery and original point annotations: Guolei Sun, Zhaochong An, Yun Liu, Ce Liu, Christos Sakaridis, Deng-Ping Fan and Luc Van Gool, Indiscernible Object Counting in Underwater Scenes, CVPR 2023. The official IOCfish5K license is CC BY-NC 4.0. Website exports are resized and WebP-compressed; films add animated overlays and camera crops to existing annotations. No commercial-use permission is implied.
Nereus also draws on FathomNet, iNaturalist and CoralVQA. Their source-specific rights are not replaced by a blanket Nereus license. Three FathomNet-derived attribute images appear in this local preview; their CC BY-NC-ND 4.0 terms require review before public deployment of the interactive presentation. The manuscript's new-attribute license and release-level license require scope reconciliation before publication.
Corresponding author: Dan Zeng, Sun Yat-sen University. For project questions, use the repository issue tracker .